-
Access the Platform
Log in to your IDXAddons account
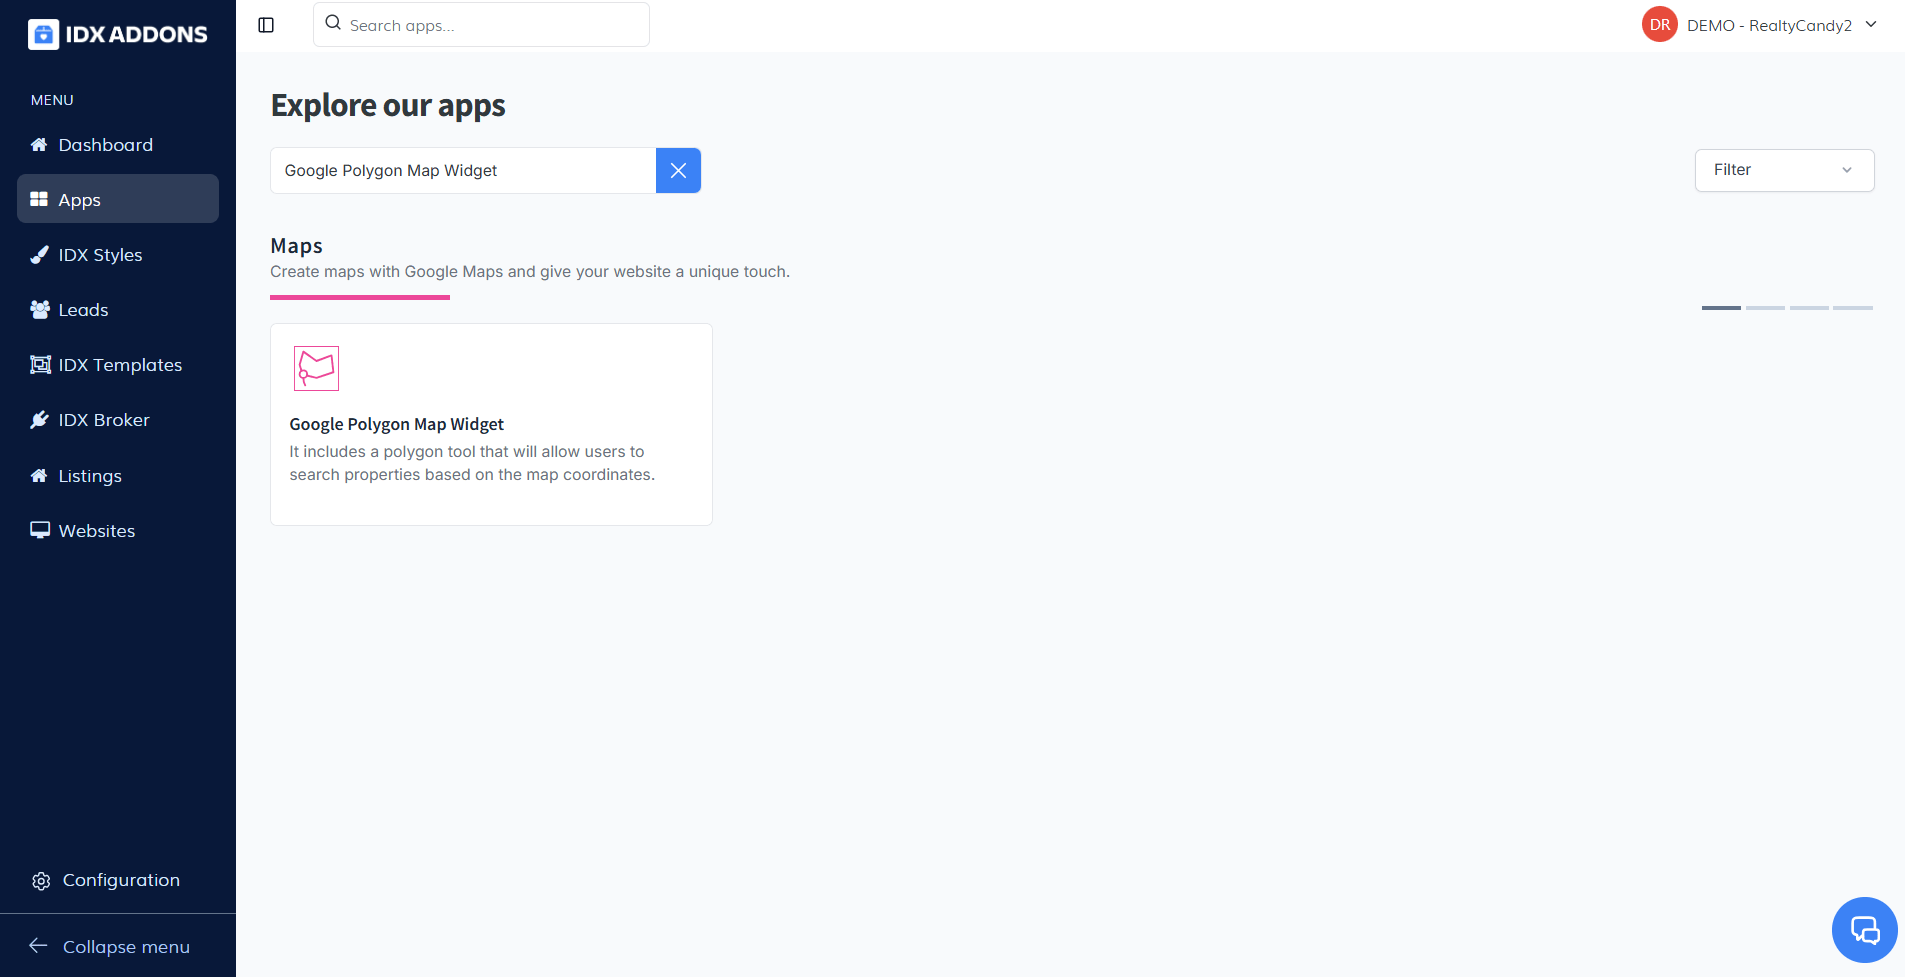
In the dashboard, select the Google Polygon Map Widget app.
-
Setup Tab
This tab contains the basic settings to personalize your map, including defining coordinates, selecting property types, and adjusting the zoom level.
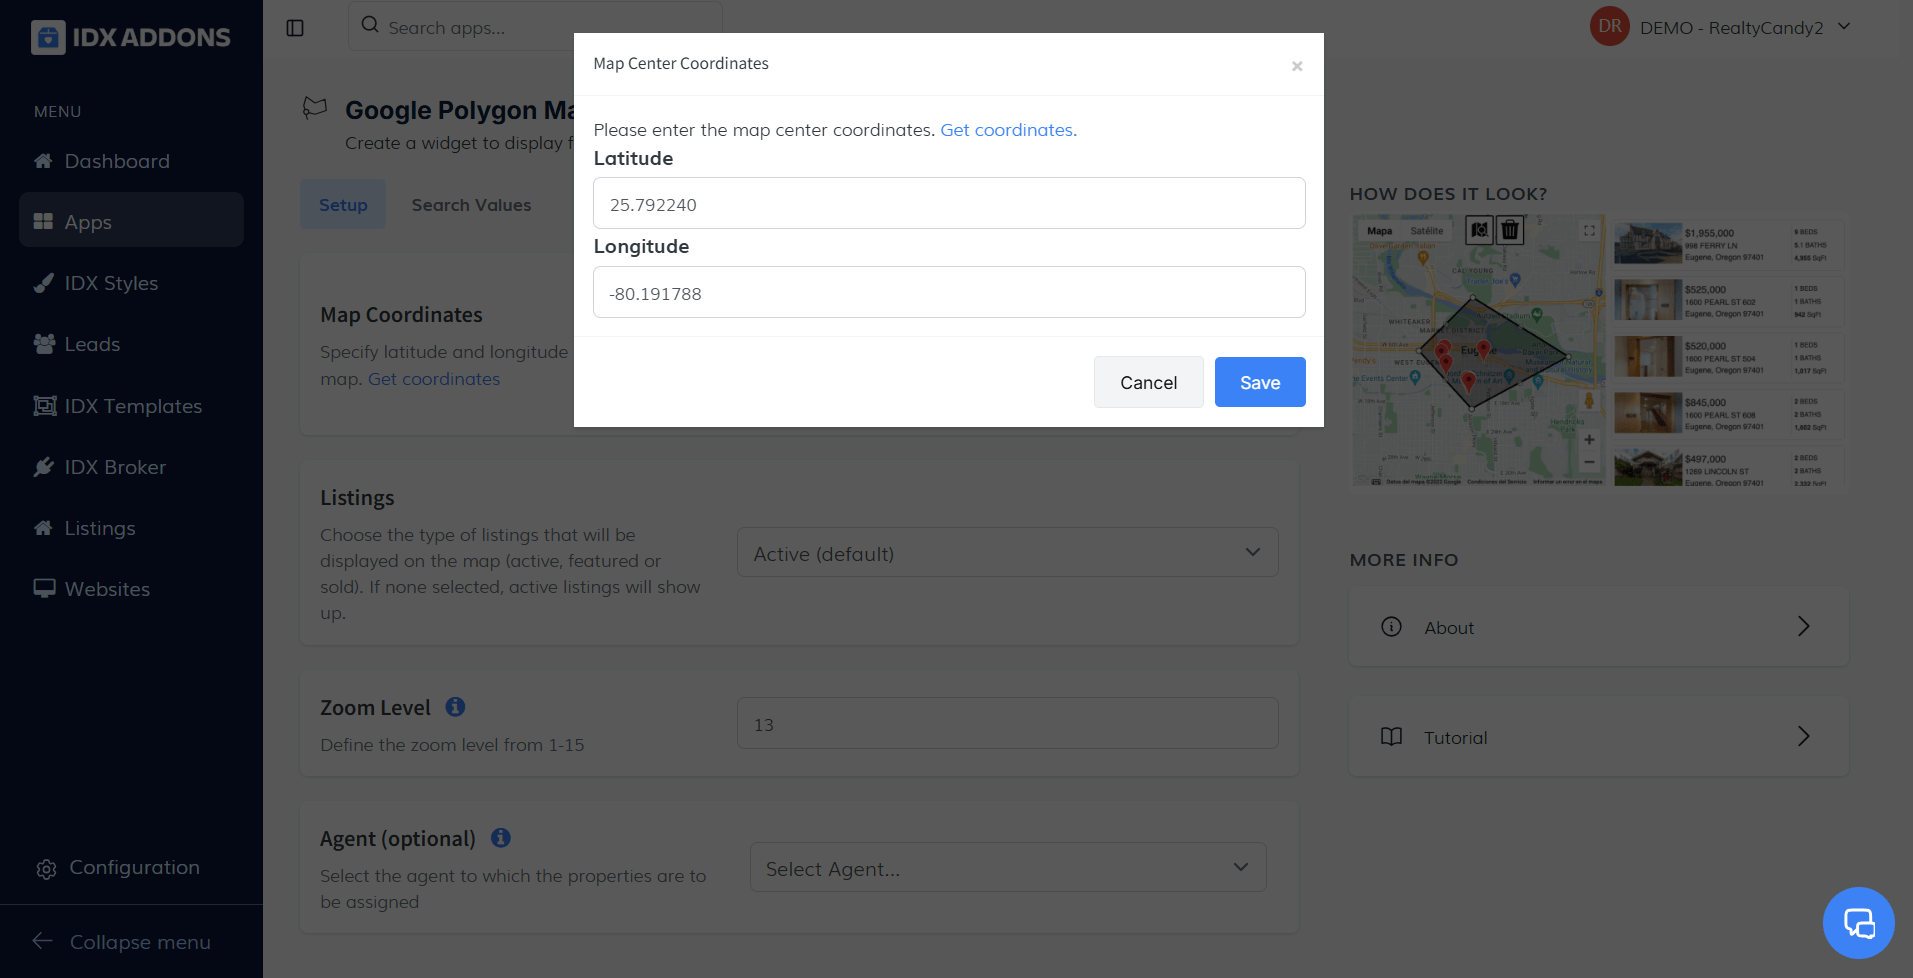
Map CoordinatesIn this section, set the latitude and longitude to center your map.
Use the "Get Coordinates" link to access an external tool for obtaining coordinates:
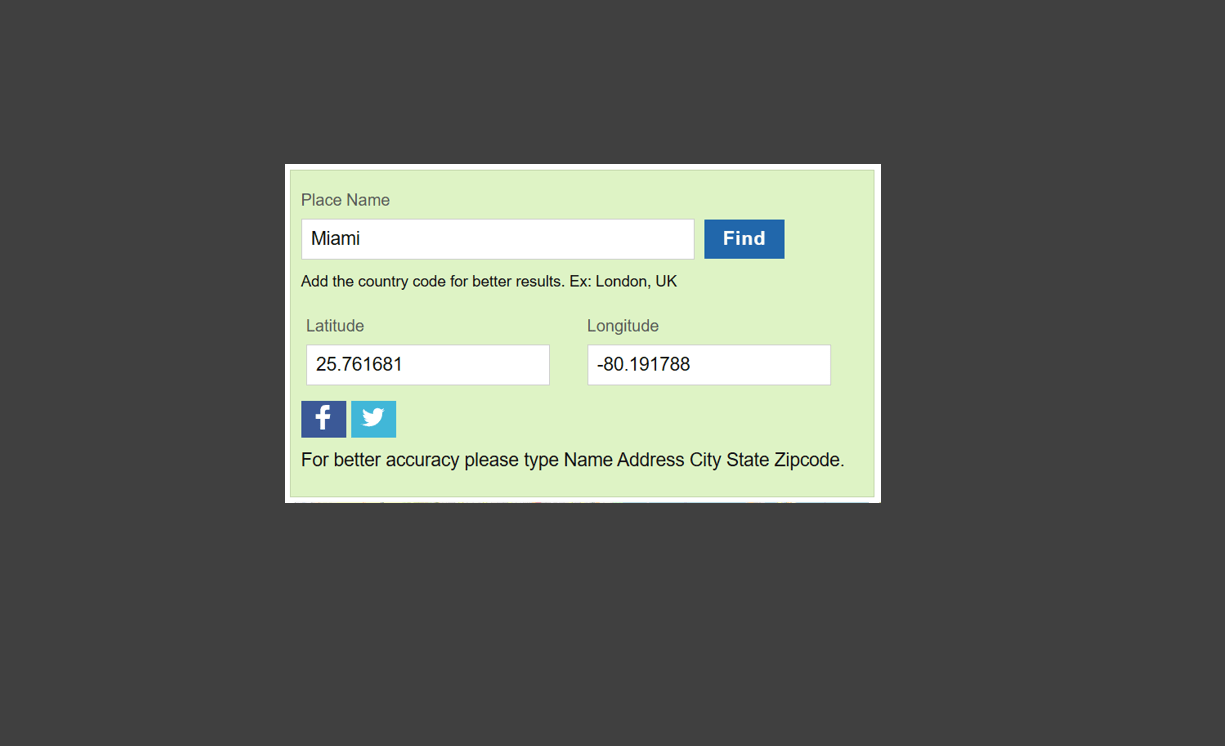
- Visit LatLong.net to find coordinates.
- Enter the name of the location in the search field and click Find to generate the coordinates.
- Copy the generated coordinates.
Return to the app, paste the coordinates into the respective fields, and click Save to store the changes.
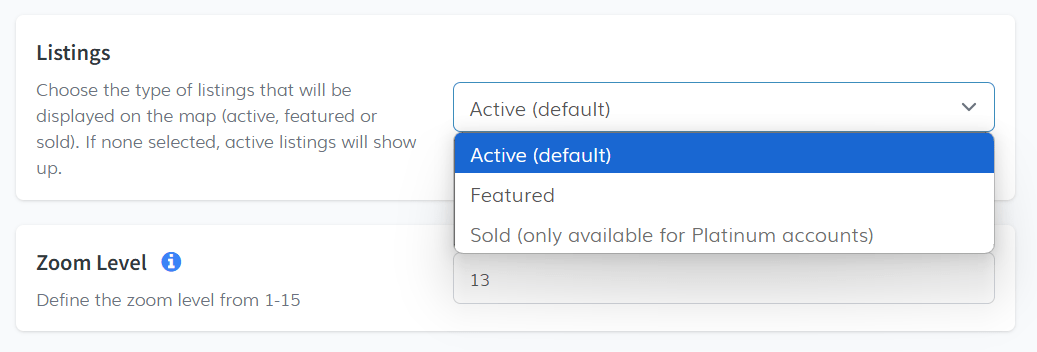
 Listings
Choose the type of properties to display on the map. Available options:
- Active: Active properties.
- Featured: Featured properties.
- Sold: Sold properties.
Select the option that best suits your needs from the dropdown menu.
 Zoom Level
Adjust the zoom level for your map:
- Minimum level: 1 (general view).
- Maximum level: 15 (detailed view).
- Suggested example: 13.
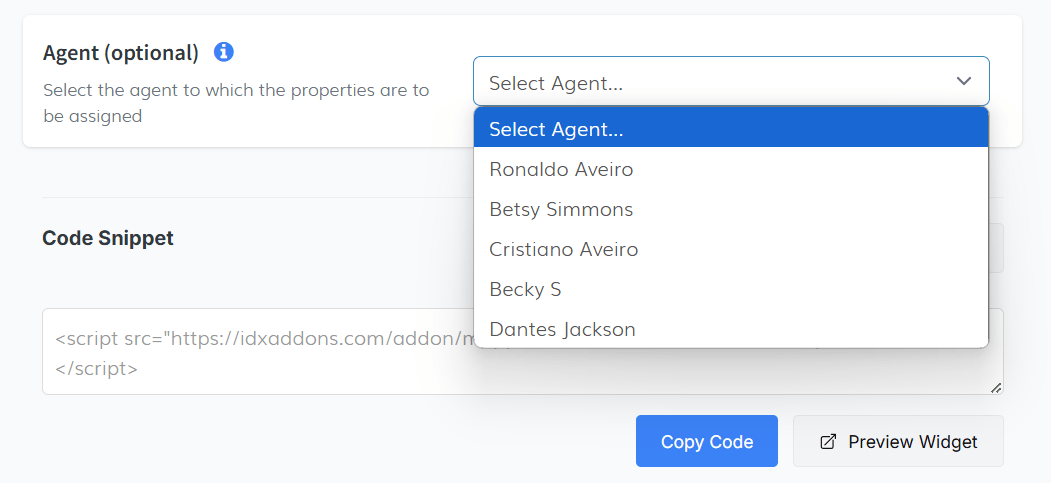
 Agent (Optional)
If you want to associate the properties on the map with a specific agent, you can select one from this section. Open the dropdown menu to view and choose from the agents already configured in your account.
-
Search Values
This tab allows you to filter the properties displayed on the map using various criteria, such as property type, location, and specific features.
MLSSelect the MLS from the dropdown menu with previously saved options.
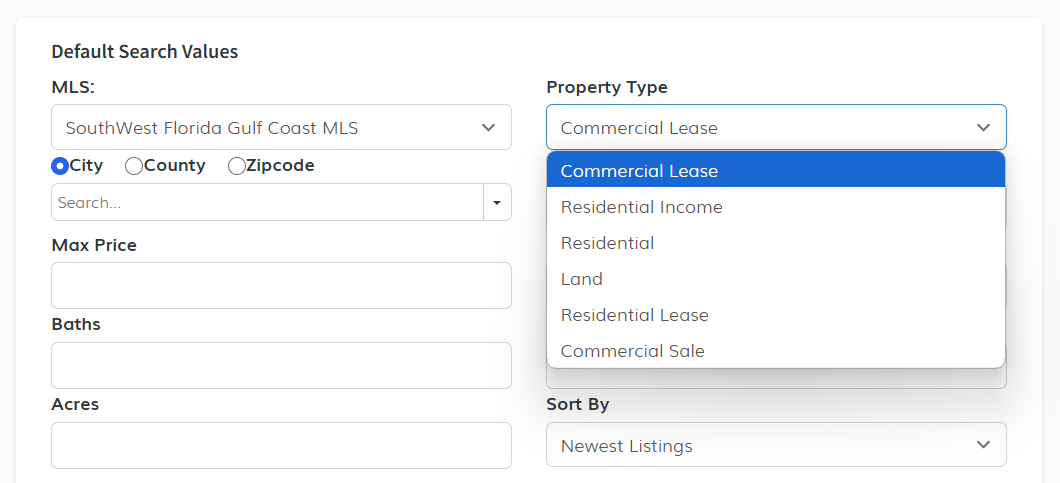
 Property Type
Choose the type of property to display. The available options will vary depending on the MLS selected. For example, in the SouthWest Florida Gulf Coast MLS, the following property types are available:
- Commercial Lease
- Residential Income
- Residential
- Land
- Residential Lease
- Commercial Sale
So if you select the Residential option, only residential properties will be displayed on the map.
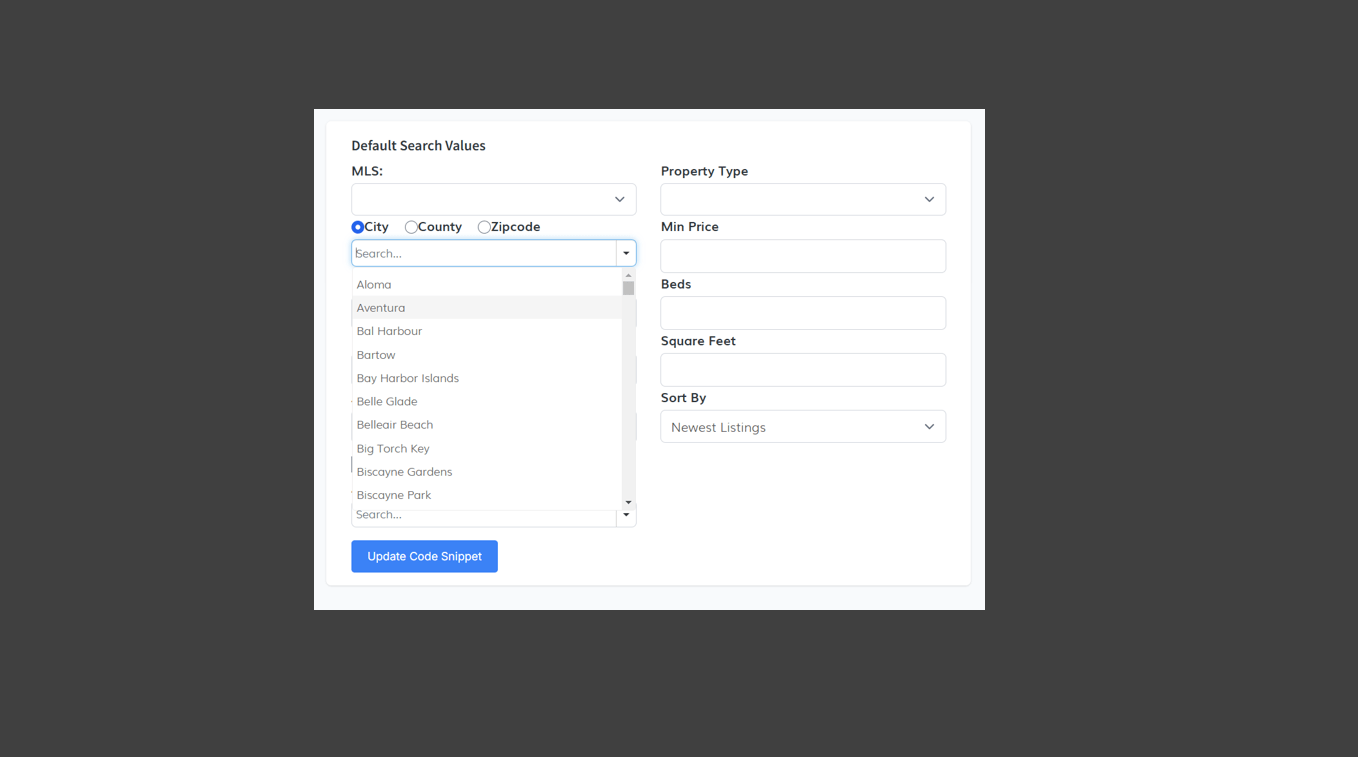
 Location
Filter properties by city, county, or ZIP code. Select an option from the dropdown to see relevant results.
 Price and Features
- Define the minimum and maximum price ranges for the properties.
- Add additional filters such as the number of beds, baths, square footage, or acreage.
 Sort By
Organize properties based on your preferences. Click to reveal preconfigured sorting options.
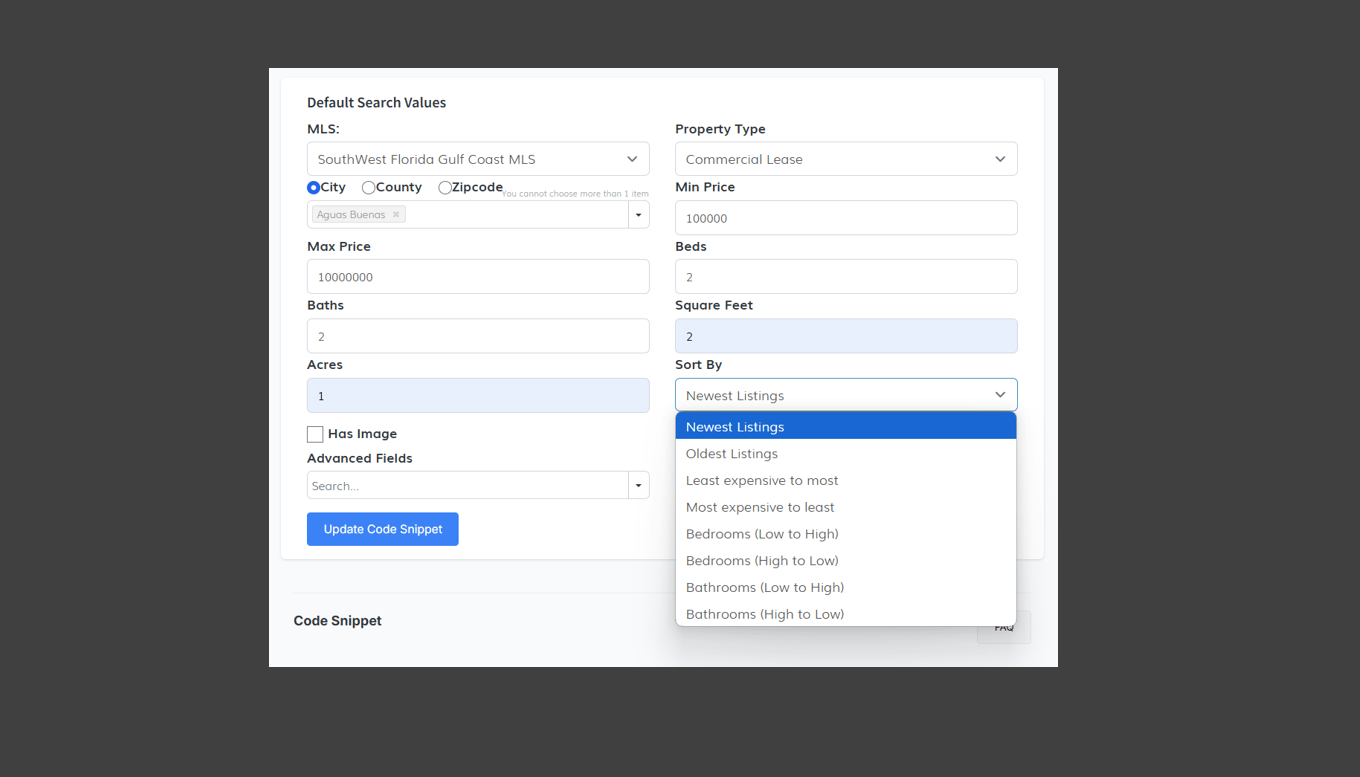 Has Image and Advanced Fields
Enable these options to display only properties with images or filter properties using specific advanced fields.
For the changes to take effect, you must click on the Update Code Snippet button.
-
Style Tab
This tab lets you customize the appearance of your map and its associated elements using styling tools and advanced settings.
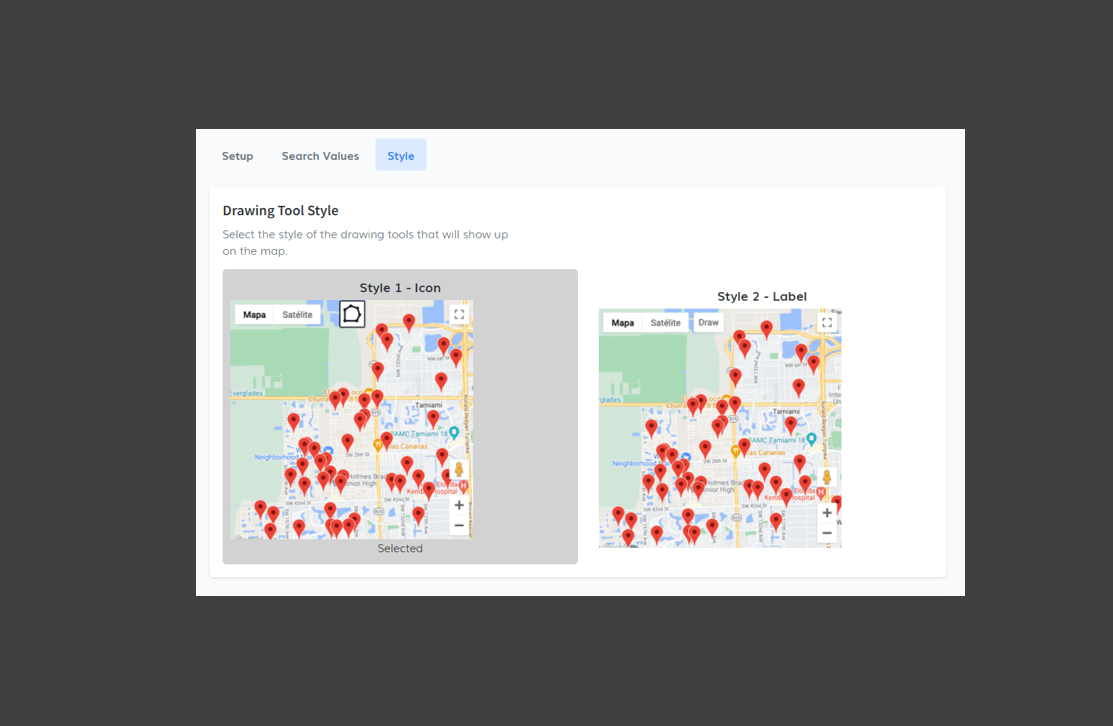
Drawing Tools StyleChoose the style of the drawing tools to be displayed on the map.
 Snazzy Maps API
In this section, you can integrate your Snazzy Maps API to apply custom styles to your map. Snazzy Maps offers a variety of color schemes for Google Maps, enabling you to personalize the look and feel of your map. By clicking the link to get your API key, you'll be able to create your own unique styles. Additionally, you can explore a variety of styles created by other users. If you find a style that suits your needs, you can easily apply it to your map.
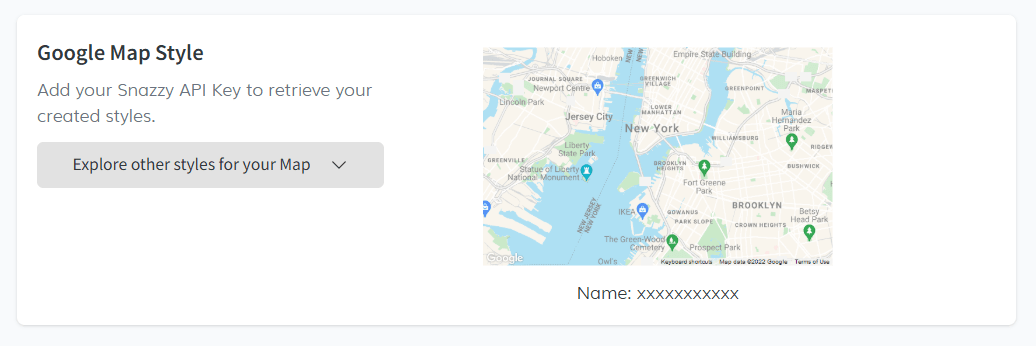
 Google Map Style
In the Google Map Style section, you have the option to customize the appearance of your map using a variety of color schemes. Snazzy Maps, a repository of user-generated map styles, allows you to explore different styles created by others. You can easily browse through the options and select the style you prefer. If you'd like to create your own map styles, you can do so by obtaining your API key from Snazzy Maps, which will allow you to customize the colors and themes for your map.
 Listings Style
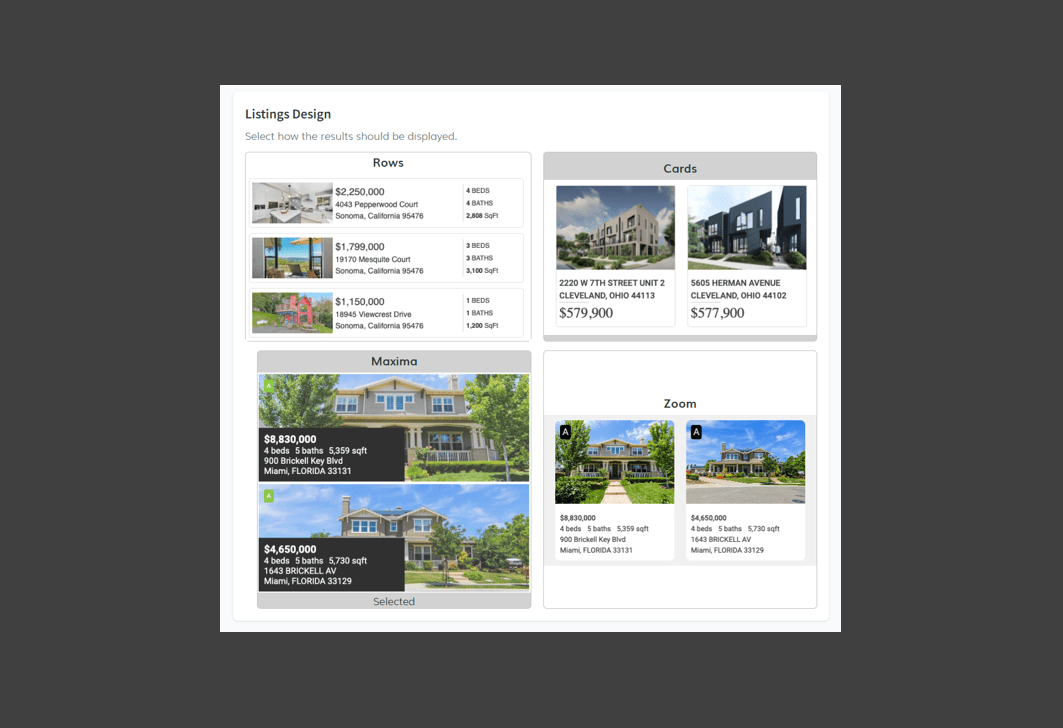
In this section, you can choose how the listings on your map will be displayed. You have the option to display listings in rows or in card format. Selecting the appropriate style will allow you to customize the layout of your listings, so you can present the properties in a way that fits your website's design.
 Custom CSS
You can also add your own custom CSS code to further personalize the appearance of your map widget. This allows you to adjust specific elements on the map, such as text color, button sizes, and layout features. Simply paste your desired CSS code into the provided field. Once you're satisfied with your changes, click "Save" to apply your customizations.

-
Copy and Paste the Code
After configuring the map, click Copy Code to copy it to your clipboard. Paste the code into the section of your page where you want the interactive Google Polygon Map widget to appear.
 Example
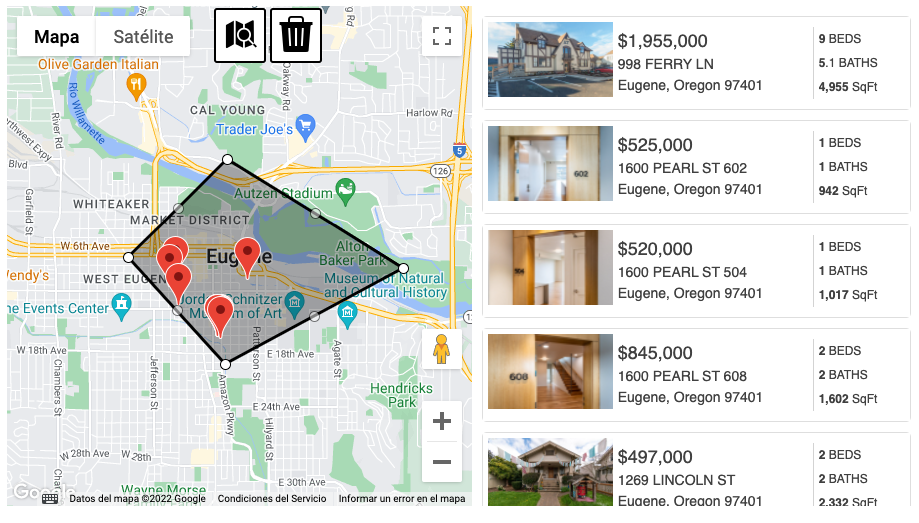
Here’s an example of how your map will look once configured: the map will center on the specified coordinates, displaying the selected listings, with the chosen zoom level and layout (rows or cards) for an optimized property browsing experience.
